Abnormal CPU utilization (system time) on a web server with NFS. Blame sendfile
The system in question is a standard FreeBSD installation with no recompiled ,,world'' nor services built from ports. Its one and only task is to serve files and web pages with Apache 2.4.
Load is negligible: varies from 0.1 to 1 request per
second, with data transfers of about 1GB per hour.
The systems itself is a KVM guest with 2 CPUs and 2 GB RAM,
but this is not essential here.
All DocumentRoot directories (~100), are mounted from a
Linux NFS server, protocol version 4.1.
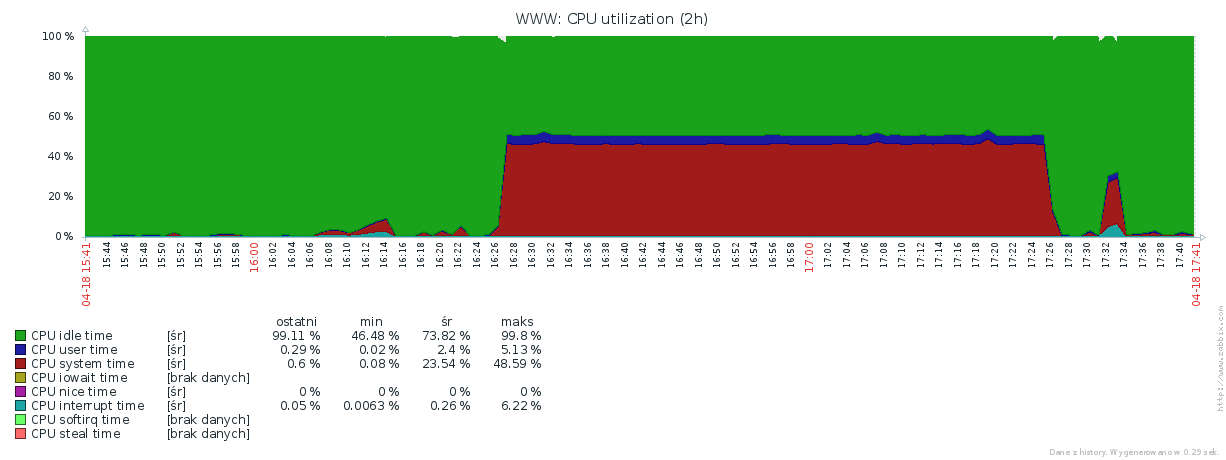
The problem is, that after several hours of normal operation the system is suddenly slowing down, and CPU utilization is raising:
There is no obvious correlation between recent HTTP requests to the server and the sudden raise of CPU usage by the kernel.
top points to Apache:
CPU 0:  3.5% user,  0.0% nice, 39.5% system,  0.4% interrupt, 56.6% idle
CPU 1:  7.8% user,  0.0% nice, 49.6% system,  0.0% interrupt, 42.6% idle
Mem: 266M Active, 428M Inact, 255M Wired, 186M Buf, 1006M Free
Swap: 1024M Total, 1024M Free

  PID USERNAME    THR PRI NICE   SIZE    RES STATE    C   TIME    WCPU COMMAND
 2910 www          27  22    0   111M    77M piperd   0  58:32  99.57% httpd
 1929 mysql        37  20    0  1270M   371M select   1   0:19   0.33% mysqld
Server-status does not reveal any suspicious
operations.. There are even no active connections. One in closing state C,
one in sending reply state W, but even the latter soon becomes C, and
nothing gets better regarding CPU load.
vmstat gives a better clue:
[root@www ~]# vmstat 1
procs  memory       page                      disks   faults         cpu
r b w  avm   fre   flt  re  pi  po    fr   sr vt0   in    sy    cs us sy id
1 0 0 2.1G  1.0G     1   0   0   0     0  110   0   28 915888   200  4 47 50
1 0 0 2.1G  1.0G     0   0   0   0     0  110   0   19 913279   156  4 46 50
1 0 0 2.1G  1.0G     0   0   0   0     0  121   1   23 918592   174  6 44 50
1 0 0 2.1G  1.0G    27   0   0   0     0  110   0   30 921621   214  5 45 50
1 0 0 2.1G  1.0G    18   0   0   0     0  110   0   26 919340   206  2 48 49
(...)
It is conspicuous there is something wrong with faults/sy
faults  Trap/interrupt rates per second.
    sy      system calls
As for the system with virtually no load, nearly one million system calls per second surely is not an acceptable number. Usually, for an idle system, this value amounts to 200 on average. It's worth noting, that this was not a single incident. It happened three times in two or three days period, i.e. since the first installation of this server.
I restarted apache to check if at least it would stop cleanly. It did. Then it started without problems, and resumed normal operation.
After restart it settled for a while:
[root@www ~]# vmstat  1
procs  memory       page                      disks   faults         cpu
r b w  avm   fre   flt  re  pi  po    fr   sr vt0   in    sy    cs us sy id
0 0 0 1.8G  1.2G     2   0   0   0     8   55  20   32   205   176  0  0 100
0 0 0 1.8G  1.2G     0   0   0   0     0   55   0   23   210   181  0  0 100
0 0 0 1.8G  1.2G     0   0   0   0     0   50   0   23   189   164  0  0 100
0 0 0 1.8G  1.2G     1   0   0   0     0   50   1   18   214   157  0  0 100
0 0 0 1.8G  1.2G     0   0   0   0     0   55   0   28   192   172  0  0 100
No doubt the problem will return in a few hours. Looking through the server-info I noticed, that Apache has been compiled with mmap(2) and sendfile(2) support.
Both are known of causing possible problems when used on network file systems. Mmap is not the case here, since no other systems has access to the mounted directories, and nothing could remove nor truncate an mmaped file, leading to a crash. The number one suspect is sendfile.
Apache documentantion mentions sendfile() in the performance tuning section:
This sendfile mechanism avoids separate read and send operations, and buffer allocations. But on some platforms or within some filesystems, it is better to disable this feature to avoid operational problems: * (...) * With a network-mounted DocumentRoot (e.g., NFS, SMB, CIFS, FUSE), the kernel may be unable to serve the network file through its own cache.
My mistake I did not run truss on the troublesome httpd process before
restarting apache, but let's see what netstat knows about it.
# netstat -m | grep sendfile
3275172833 sendfile syscalls
1527 sendfile syscalls completed without I/O request
1824 requests for I/O initiated by sendfile
16748 pages read by sendfile as part of a request
25265 pages were valid at time of a sendfile request
10509 pages were read ahead by sendfile
0 times sendfile encountered an already busy page
There were over three billion sendfile syscalls since last reboot, which
divided by the faults/sy rate quoted above, gives about 3400 seconds =
55 minutes spent on calling sendfile(). That's a perfect match with the
time of heavy CPU utilization shown on the graph.
Turning off EnableSendfile fixed it for good.
Nevertheless I wonder what exactly was going on under the hood. There were no pending requests to the server, so Apache must have been stuck on sendfile() for an hour, and could not complete.
As this is a production server, I will not break it again just to find out. Perhaps I will set up another one, to recreate this problem and investigate it deeper.